The Current State of the Housing Market
The Fed hiked its benchmark Fed Funds Rate, while there's more to January's job data than the headlines suggest. Plus, find out what the latest news on home price appreciation really means, all ahead in these stories:
- Are More Fed Rate Hikes Ahead This Year?
- January Job Growth Not as Strong as It Appears
- Private Payrolls Disappoint in January
- Jobless Claims Reflect Tight Labor Market
- Talk of Housing Crash Not Supported by Appreciation Data
Are More Fed Rate Hikes Ahead This Year?
As expected, the Fed hiked its benchmark Fed Funds Rate by 25 basis points at its meeting last Wednesday. The Fed has now hiked the Fed Funds Rate eight times since last March, bringing it to a range of 4.5% to 4.75%. The Fed Funds Rate is the interest rate for overnight borrowing for banks and it is not the same as mortgage rates. When the Fed hikes the Fed Funds Rate, they are trying to slow the economy and curb inflation.
What's the bottom line? In the press conference following the meeting, Fed Chair Jerome Powell acknowledged that inflation has been declining, which he noted was encouraging. However, he said the Fed has more work to do to ensure inflation is on a sustained downward path.
Powell signaled that "a couple" more hikes to the Fed Funds Rate would be appropriate, with the next decision coming at their meeting on March 21-22. He emphasized that the Fed would continue to make their "decisions meeting by meeting, taking into account the totality of incoming data and their implications for the outlook for economic activity and inflation."
January Job Growth Not as Strong as It Appears
The Bureau of Labor Statistics (BLS) reported that there were 517,000 jobs created in January, which was much stronger than estimates. Revisions to the data from November and December added 71,000 jobs in those months combined. The unemployment rate declined from 3.5% to 3.4%, which is the lowest since 1969.
What's the bottom line? There are two reports within the Jobs Report and there is a fundamental difference between them. The Business Survey is where the headline job number comes from and it’s based predominately on modeling and estimations. The Household Survey, where the Unemployment Rate comes from, is derived by calling households to see if they are employed. The Household Survey has its own job creation component and it showed that there were 894,000 new jobs created last month.
While these job growth figures appear strong, it's important to note that there were big adjustments to how the data was calculated in January. New seasonal factors, new benchmarks and new population estimates/controls were instated. If we remove these adjustments, the number of job creations in the Household Survey would have only been 84,000 versus the 894,000 that were reported.
In addition, looking deeper at the face value numbers, of the 894,000 job creations in the Household Survey, 606,000 were from part-time workers.
Considering the number of large layoffs that have been reported across the country, along with the revisions, new benchmarks and population adjustments made to the reporting by the BLS, the labor sector likely isn't as strong as their January Jobs Report suggests.
Private Payrolls Disappoint in January

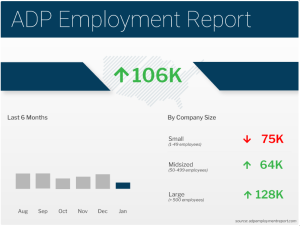
Private payrolls came in much lower than expected last month, as the ADP Employment Report showed that there were just 106,000 jobs created in January. The construction sector accounted for 24,000 jobs lost, which is understandable given the slowdown we have seen among homebuilders. Small businesses with under 50 employees were hit hardest, as they lost 75,000 jobs, while large firms with 500 or more employees posted 128,000 job gains.
ADP also reported that annual pay for job stayers increased 7.3% year over year, which was unchanged from the previous report. Job changers saw an average increase of 15.4%, up from 15.2%.
What's the bottom line? Nela Richardson, chief economist for ADP, said, "In January, we saw the impact of weather-related disruptions on employment during our reference week." ADP uses the week that includes the 12th to collect payroll sampling data each month. They blamed the extreme weather during that timeframe in January, including snow in the Midwest and flooding in California, for the weaker than expected report. However, it was mild in other parts of the country and there are supposed to be seasonal adjustments reflected in the data, suggesting that weather was not the only contributing factor to the report.
Jobless Claims Reflect Tight Labor Market

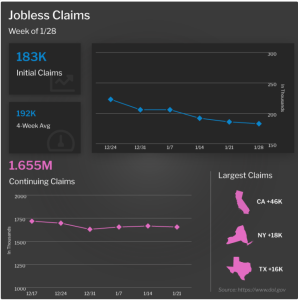
The number of people filing for unemployment benefits for the first time declined for the third straight week, as Initial Jobless Claims dropped by 3,000 to 183,000. Continuing Claims, which measure people who continue to receive benefits after their initial claim is filed, fell 11,000 to 1.655 million.
What's the bottom line? We are continuing to see a tight labor market where companies are doing their best to hold on to workers. However, Continuing Claims have risen by nearly 300,000 over the last four months, which also suggests it's becoming harder for many to find a job if they are let go.
Talk of Housing Crash Not Supported by Appreciation Data

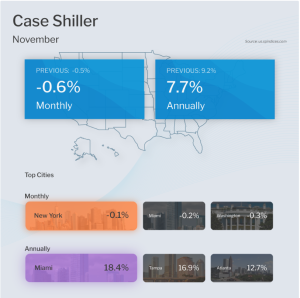
The Case-Shiller Home Price Index, which is considered the "gold standard" for appreciation, showed home prices fell 0.6% from October to November but they were 7.7% higher when compared to November of 2021. This annual reading is a decline from the 9.2% gain reported in October.
The Federal Housing Finance Agency (FHFA) also released their House Price Index, which revealed that home prices fell 0.1% from October to November. While prices rose 8.2% from November 2021 to November 2022, this was a decline from the 9.8% annual increase reported in October. FHFA's report measures home price appreciation on single-family homes with conforming loan amounts, which means it most likely represents lower-priced homes. It also differs from Case-Shiller's data, in that it does not include cash buyers or jumbo loans.
What's the bottom line? Home prices have been softening nationwide, but S&P DJI Managing Director Craig J. Lazzara noted that they are only down 3.6% from their peak last June. This is a far cry from a housing crash of 20% that some in the media are predicting.
In addition, home prices in Case-Shiller's 10-City and 20-City Indexes are down 5% from their peak, showing that prices in these major cities are declining a bit more than they are in the nation overall. Prices in some of these locations were a bit overheated and are now giving back some gains. When removing those cities, prices around the rest of the country are flatter from the peak overall.
Source: https://mbshighway.com

